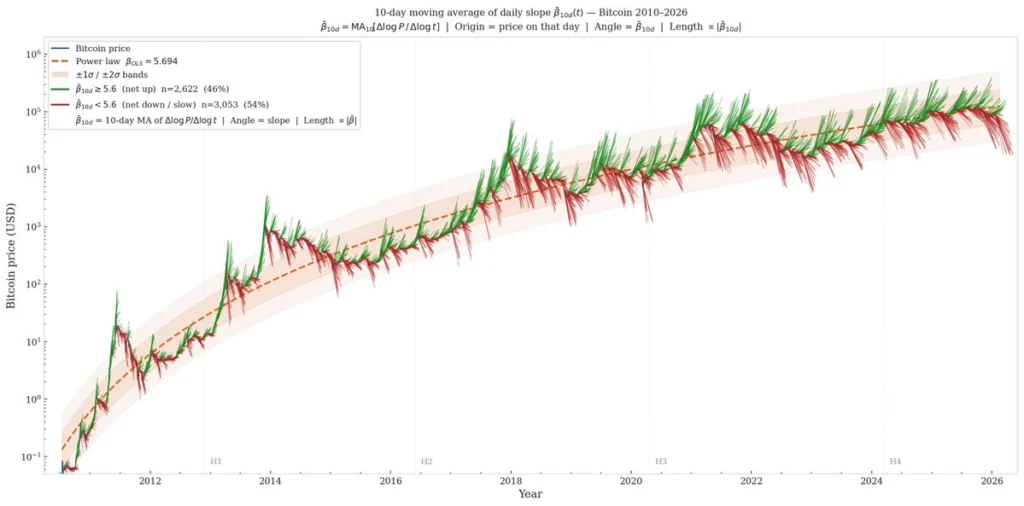
The new iteration of the model moves beyond the traditional price corridor to track Bitcoin’s 10-day local growth rate in log-log space. By visualizing Bitcoin’s movement as a series of green and red rays, Santostasi has created a vector field that measures the velocity and direction of price action relative to the long-term power-law trend. Green rays indicate periods where Bitcoin’s growth outpaces the long-run average, while red rays signal deceleration or contraction. This transition from "price-at-time" to "motion-around-attractor" provides a more nuanced lens through which to view Bitcoin’s market cycles, particularly as institutional capital alters the asset’s historical volatility patterns.
The Theoretical Foundation: From Price Corridors to Vector Fields
For over a decade, the Bitcoin Power Law has been characterized by its simplicity: the assertion that Bitcoin’s price growth follows a predictable mathematical relationship with time when plotted on a log-log scale (where both axes increase by factors of ten). Historically, investors used this model to identify "fair value" by observing how closely spot prices hugged a central trend line. However, the 2026 update acknowledges that as the market matures, the simple "near the line" analysis is insufficient for capturing the complexities of institutional adoption.
The introduction of the 10-day averaging growth rate aims to filter out high-frequency market noise while preserving the signal of broader market shifts. In Santostasi’s framing, the power law acts as an "attractor"—a central path that Bitcoin’s price eventually returns to after periods of speculative overshoot or capitulation. The new visualization makes the pattern of mean reversion across halving eras more explicit. The four major halving cycles appear as alternating clusters of green and red, representing the rhythmic pulse of bull markets pushing above the attractor and bear markets pulling back toward the floor.
Chronology of the Power Law and Current Market Benchmarks
The Power Law model has survived multiple market regimes, from the early retail-driven spikes of 2013 and 2017 to the liquidity-injected surge of 2021. In 2026, the model faces its most rigorous "stress test" as the price encounters a rising theoretical floor. Current data from analytical platforms such as Newhedge and Bitbo provide specific benchmarks for this test:
- The Power Law Centerline: Currently sits near $124,477. This represents the "fair value" or the long-term historical average growth path.
- The Power Law Floor: Positioned at approximately $52,280. This is the critical support level that the model suggests Bitcoin should not breach if the long-term power-law relationship holds.
- The 2026 Year-End Projection: Estimates place the year-end price at roughly $142,782.
These figures illustrate the tension within the current market. While the $142,000 target offers a bullish roadmap, the $52,000 floor creates a sharp boundary for falsifiability. Critics argue that if Bitcoin remains stagnant in the high-$60,000 range for an extended period, the rising floor will eventually catch up to the price, forcing a breakdown of the model’s historical validity.

The Institutional Factor: ETF Flows and Market Plumbing
The primary challenge to the Power Law’s predictive power in 2026 is the structural change brought about by U.S. spot Bitcoin ETFs. These instruments have fundamentally altered the "plumbing" of the Bitcoin market, introducing a level of daily institutional demand and redemption that did not exist during previous cycles.
Data compiled by Farside Investors highlights the scale of this impact. As of mid-March, cumulative net inflows into U.S. Bitcoin ETFs reached approximately $56.1 billion. The distribution of these flows is highly concentrated, with BlackRock’s IBIT seeing nearly $63.1 billion in cumulative net inflows, while the Grayscale Bitcoin Trust (GBTC) continued to experience significant outflows totaling roughly $25.9 billion.
The volatility of these flows—such as a $461.9 million inflow on March 4 followed by a $348.9 million outflow on March 6—fits the "regime" view of the new Power Law chart. These fluctuations are visualized as shifts between green and red rays. In this context, green clusters represent periods where macro allocators and ETF participants are aggressively pushing the price above the long-run pace, while red clusters reflect cooling periods or capital rotation. The model no longer just tracks price; it tracks the pulse of institutional sentiment.
Mining Dynamics and the Production Cost Anchor
Parallel to the ETF narrative is the continued industrialization of the Bitcoin mining sector. Recent data indicates that the network’s security and capital intensity are reaching unprecedented levels. In late February, Bitcoin’s mining difficulty saw a 15% jump to 144.4T—the largest percentage increase since 2021—even as price action remained relatively muted. Furthermore, the total network hashrate recovered to the milestone of 1 zettahash per second.
This divergence between rising network security and stagnant price is significant for the Power Law model. Supporting analysis by researchers like D Cane has linked mining difficulty directly to the "production cost" of Bitcoin. A regression analysis of Bitcoin’s log production cost versus log difficulty yields an R-squared value of 0.9845, indicating an extremely strong statistical fit. This suggests a mechanical reason for why the price returns to the power-law attractor: the underlying cost to produce and secure the asset scales at a predictable rate, creating a fundamental floor that supports the price over long horizons.
Contrasting Forecasts and Bearish Pressures
Despite the mathematical elegance of the Power Law, traditional financial institutions remain cautious. A February report from Standard Chartered underscored this skepticism, as the bank revised its end-2026 Bitcoin target down to $100,000. More significantly, the bank warned of a potential slide to $50,000 before a meaningful recovery could take place.

This $50,000 downside forecast is particularly noteworthy because it sits directly atop the Power Law’s $52,280 floor. If Bitcoin were to drop to these levels, it would represent a "maximum stress" scenario for the model. For skeptics, such a move would suggest that the Power Law is not a "law" at all, but rather a historical curiosity that is increasingly being superseded by traditional macro forces, interest rate cycles, and global liquidity trends.
Analysis of Implications: Three Scenarios for 2026
The validity of Giovanni Santostasi’s model over the coming months will likely be determined by one of three primary scenarios:
- The Base Case (Regime Persistence): In this scenario, Bitcoin remains above the $52,280 floor but fails to reclaim the $124,477 centerline for an extended period. This would reflect a market characterized by uneven ETF flows and steady network growth without a powerful macroeconomic tailwind. The Power Law would survive as a broad boundary, but its utility for short-term traders would diminish.
- The Bull Case (Re-acceleration): A return toward the $124,477 trend level and the $142,782 year-end projection would occur if ETF demand becomes more persistent and global interest rates begin to decline. In this setup, the "green rays" on the new chart would signal a genuine re-acceleration of growth, validating the Power Law as a robust regime model for the institutional era.
- The Bear Case (Model Breakdown): A sustained stay in the $50,000 to $70,000 range would put the model’s floor under direct pressure. If the price trades below the floor for more than a brief period, the Power Law would lose its status as a reliable attractor. This would indicate that outside variables—such as regulatory shifts or macro-economic strain—have become the dominant drivers of value, rendering the historical curve obsolete.
Conclusion: From Retail Adolescence to Institutional Adulthood
The Bitcoin Power Law has transitioned from a niche tool used by early adopters to a sophisticated framework attempting to explain the behavior of a trillion-dollar asset. The 2026 update by Santostasi acknowledges that Bitcoin is no longer the same system it was in 2010. The introduction of the "motion" layer and the tracking of local growth rates are attempts to adapt a physics-based model to the realities of a market populated by BlackRock, Fidelity, and industrial-scale miners.
Whether the model holds through 2026 remains an open question. The line on the chart will remain, but its influence on market participants depends on Bitcoin’s ability to respect its historical boundaries. If the price returns to the centerline, the Power Law will be hailed as a remarkably durable law of digital scarcity. If the price sags as the floor rises, it will serve as a reminder that even the most consistent mathematical trends can be disrupted by the unpredictable forces of global finance. For now, the "rays" are the primary indicator to watch, offering a real-time visualization of Bitcoin’s struggle to maintain its long-term trajectory in a rapidly changing world.